Medicare Trustees Report
Notes from the 2021 Report on Medicare and 2022 Report . You should read the KFF FAQ on Medicare insolvency for a deep dive.
The Medicare Trustees report is valuable for understanding how Medicare is managed and funded. A board of trustees that governs Medicare reports annually on the financial and actuarial health of the funds that pay for Medicare.
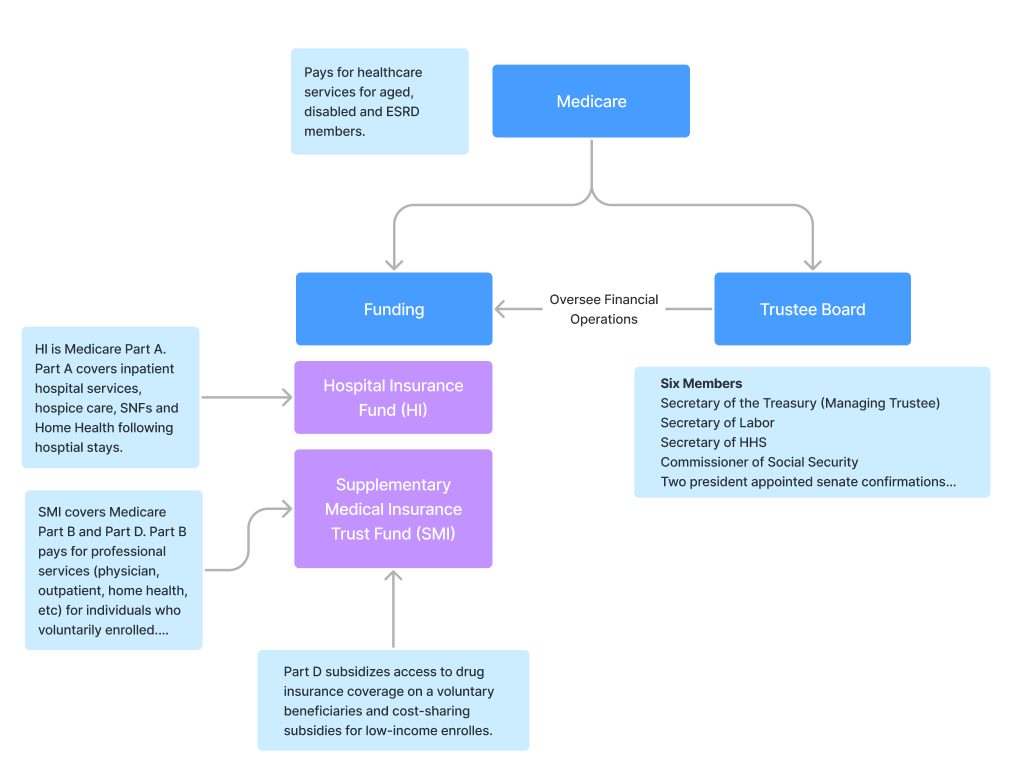
Medicare pays for members through two funds. HI, or the Hospital Insurance fund, covers Part A claims. SMI or the Supplementary Medical Insurance Trust fund covers Part B and D services for individuals who enroll voluntarily or those low-income enrollees. The board of trustees oversees the financial operations of the funds and annually provides projections on allowable payment levels based on tax and premium revenues. (pg. 1).
One of the primary functions of the board then, is reporting on the solvency health of the funds. The report notes that lawmakers have never allowed the HI fund to run out of money.
2020 and COVID
COVID had a major impact on the funds operations. First, money flowing into the funds comes from payroll taxes and premium revenues. Payroll tax revenue flowing into the fund reduced due to the impact on the labor market in 2020. At the same time, spending increased for COVID testing and disease management along with public health emergency provisions.
Here is a quick breakdown of impacts to the fund in 2020:
- Payroll taxes dropped off decreasing revenue
- Spending increases for direct treatment and testing of COVID
- 3 day inpatient requirement for SNF stays were waived
- Payments for IP admissions related to COVID increased 20%
- Telehealth Expanded
- Non-COVID spending declined (electives)
- Prescriptions, DME, physician administered drugs and Hospice saw little impact
The board had to adjust for the revenue and spending impacts. On the spend side, they had to account for the direct cost to treat, test and provides vaccines for COVID. Going into 2022, the board expected an increased return of services for those members that delayed care. (pg. 2).
Another COVID challenge was the disruption in claims payments for providers. Imagine a specialist whose business dropped off; cash flow becomes an issue in keeping your business solvent.
During this time, Medicare expanded the AAP (Accelerated and Advanced Payments) program (also known as CAAP). CAAP provides funding to Part A and Part B providers in case of a disruption in claims submission or processing. The CARES act (116-136) increased maximum payments during the emergency period to include:
- 100% of Medicare payments in the last 6 months for IP, acute care, pediatric and certain cancer hospitals
- 125% of Medicare payments in the last 6 months for CAHs
- 100% of Medicare payments in the last 3 months for all providers and suppliers
Repayment periods and amounts were then adjusted under the Continuing Appropriations Act 2021 and Other Extensions Act.
- Recoupments start 1 year after the AAP payment
- 25% of the AAP amount over the first 11 months
- 50% over the following 6 months
- After 29 months the full balance is due in 30 days
In total, the HI fund paid out $67.1 billion, while the SMI paid $40.0 billion for a total of $107B. The trustees projection is that all funds will be repaid by Sept 2022 resulting in no net change to the fund. What is impacted is the timing of payments made.
The key takeaway is that by 2024 the financial impact of COVID on Medicare (outside of the longer-term health impact on the population) should no longer be noticeable. COVID did highlight the difficulty in projecting long-term expenditures for the fund. The following section highlights why multi-decade Medicare projections are so problematic.
Major Findings
Reviewing major financial findings from the 2021 and 2022 reports.
- 2020 - Medicare covered 62.6 million people, 54.1 million aged 65 and older and 8.5 million disabled. In 2021, 63.8 million, 55.5 million aged 65 and older and 8.3 million disabled.
- 40% of members enrolled in Part C in 2020, increasing to 43% in 2021.
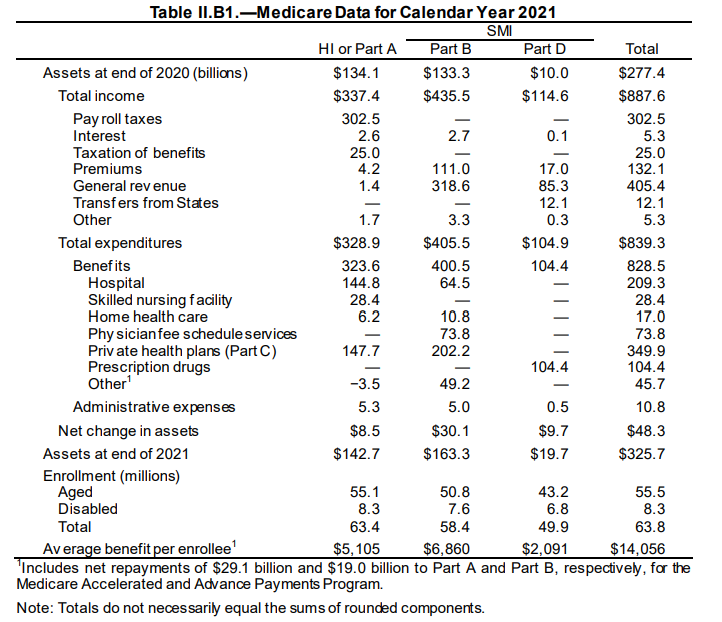
- 2020 - Total expenditures were $925.8B. Total income was $899.9B. Income was $894.6B in non-interest income, 5.3B in interest. Assets dropped by $26.0B to $277.3B
- 2021 - Total expenditures were $839.3B, income $887.6B. Income was $887.6B, consisting of $882.3B in non-interest income and $5.3B in interst earnings.
- Solvency depletion dates moved from 2026 to estimated 2028. 202 HI spending is expected to be lower than 2021, with higher revenue because average wages and number of workers increased. After 2023, it is expected that provider payments will increase increasing overall HI expenditure.
- SMIs 10 year projection is better due to premium revenue increases that reset each year to cover the funds cost. 2022 Part B premium is $170.10. Average annual growth of Part B over the past 5 years has been 6.7% vs. 4.2% for GDP.
- 5 year expected growth rates in Part B are 10.3% and 7.4% for Part D - again faster than expected GDP growth of 5.3%.
- HI majority financing is a payroll tax. The employer and employee pay 1.45% (or 2.9% self employed) of net earnings. High earners (2013 on), or those with $200k in income as a single, or $250k join) paid an additional 0.9%.
- SMI is primarily funded through the Treasury general fund (79% of cost in 2021) along with member monthly premiums for Part B and D. Both HI and SMI also earn interest on their funds.